Join me on an adventure for the curious mind.

Category: Information Technology

How to Restrict Membership of the Local “Administrators (built-in)” Group via Group Policy

As a system administrator, you know that having control over the local Administrators group on domain joined PCs is critical for maintaining security. Luckily, you can establish this control by using Group Policy Preferences.

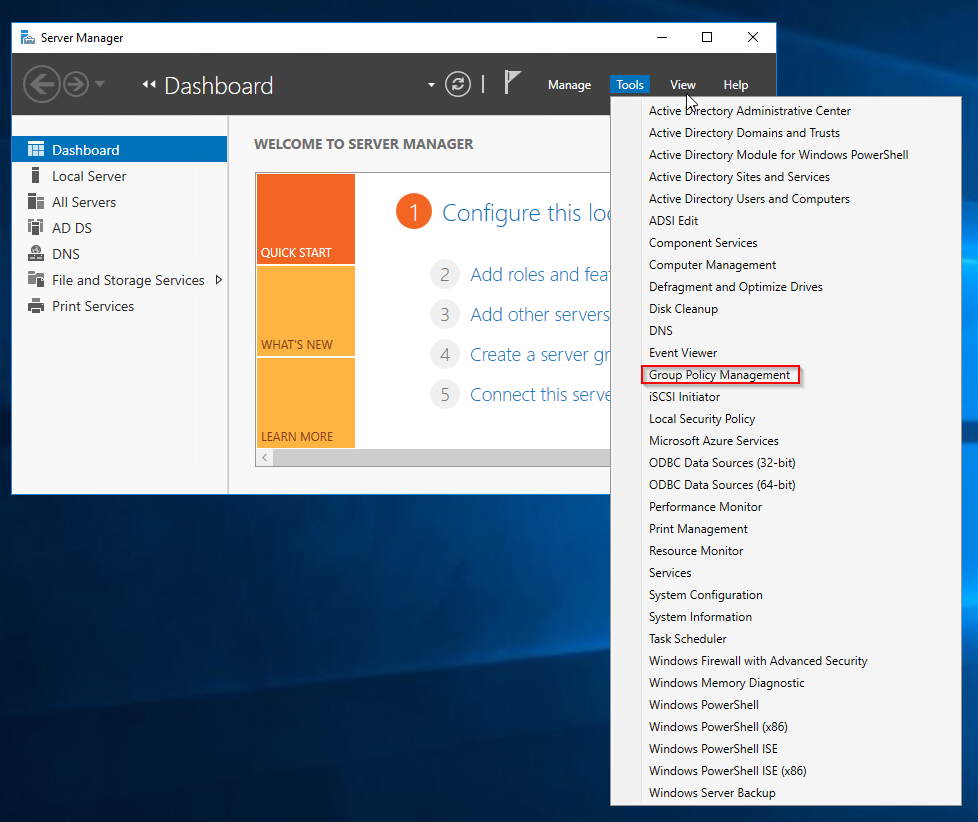
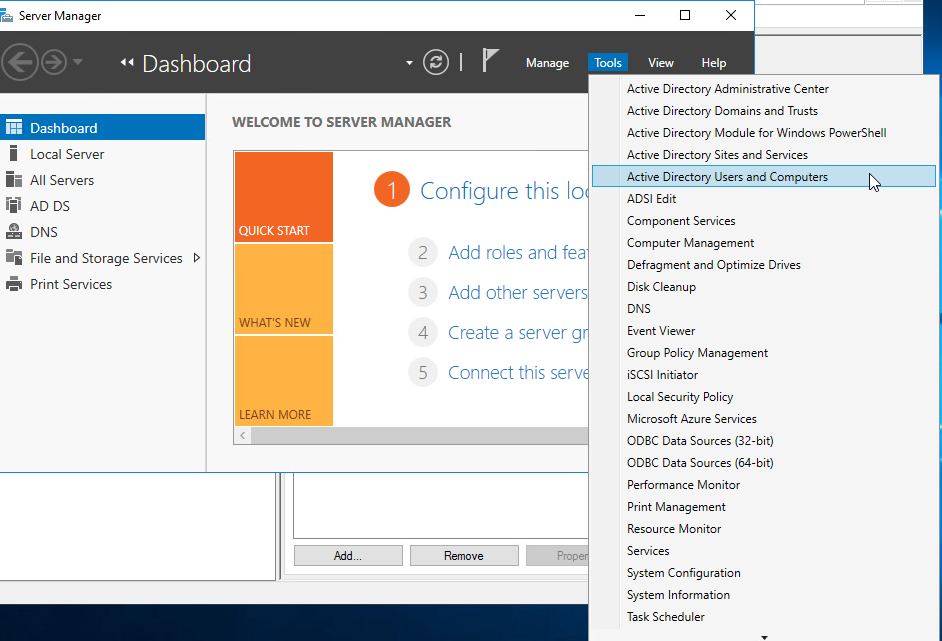
Open Server Manager and click Tools> Group Policy Management.

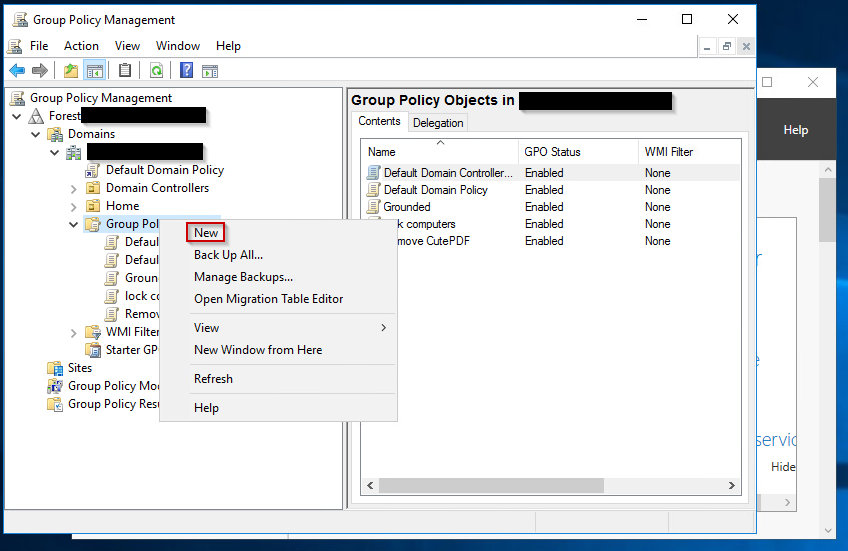
Right click on Group Policy Objects and click New.

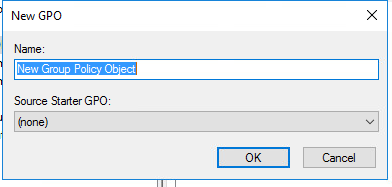
Give it a name like Restrict admin access and click on.

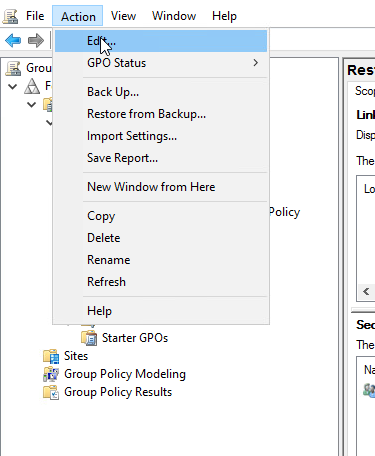
Highlight your new GPO and click Action > Edit.

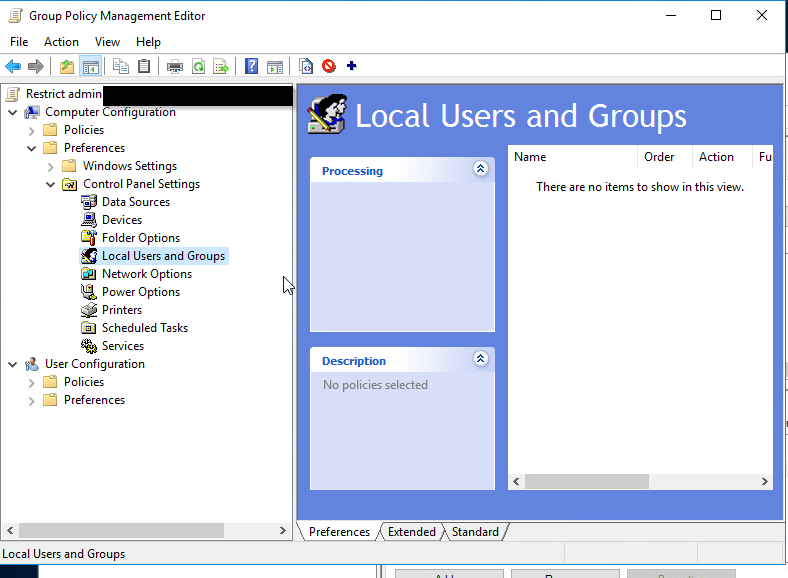
To configure this policy, go to Computer Configuration > Preferences > Control Panel Settings > Right click on Local Users and Groups and Select New > Local Group. Now hit OK.

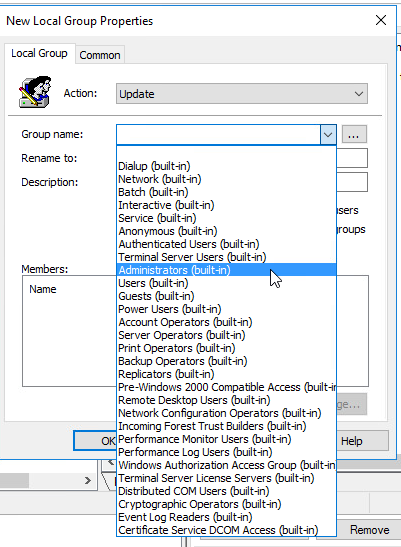
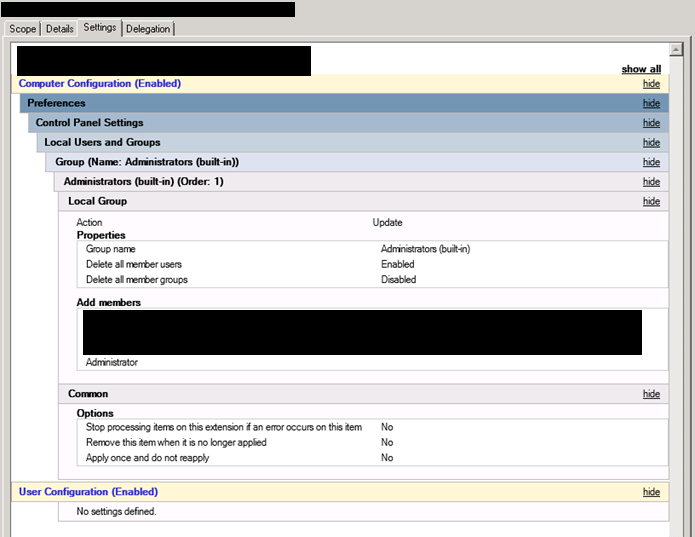
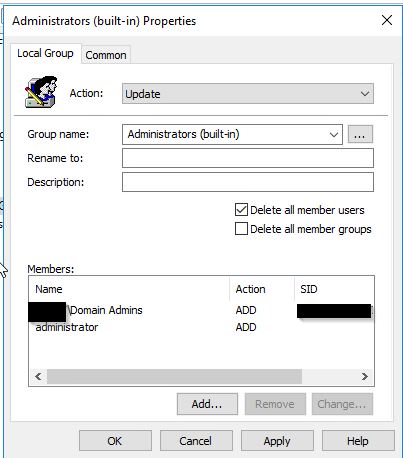
In the Group Name Field there is a drop down, choose the “Administrators (built-in)” group. Check the box that says Delete all member users. Click the add button. Add Domain Admins and any other users or groups you would like to still be an admin. WARNING: it is imperative that correctly configure these members or you can lose admin access to anything this is applied to.

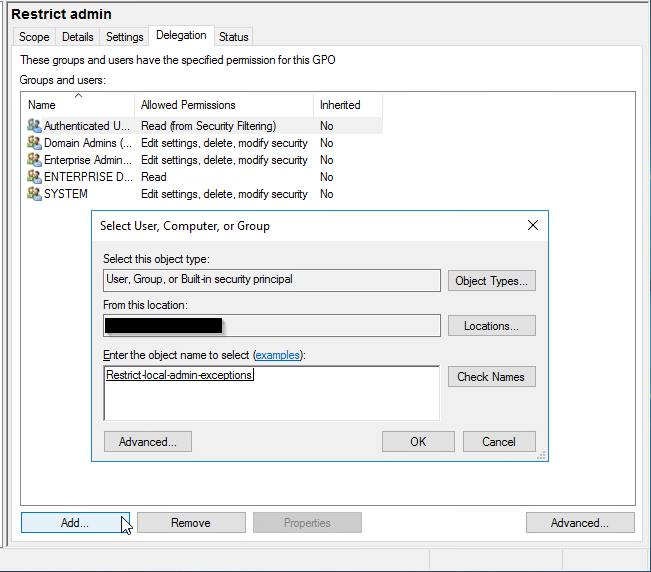
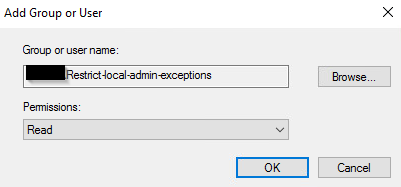
Next we go back to our GPO and click Delegation at the bottom click Add. Now add your freshly made security group and click OK.

In the next window, click OK don’t worry about the settings yet, we are going to change the permissions in the next step.

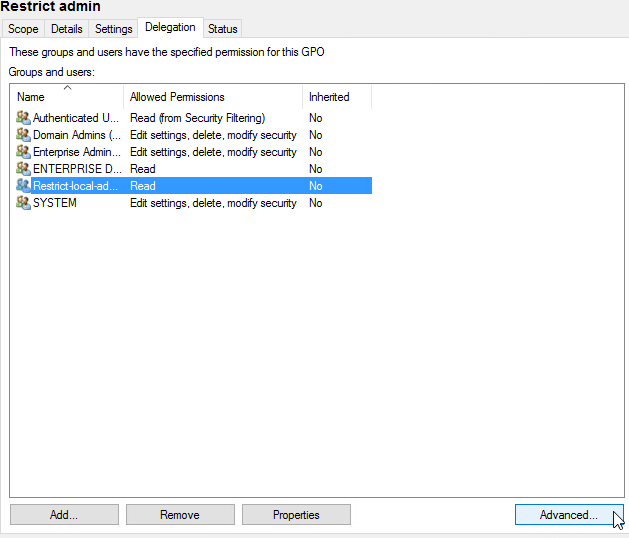
Next we are going to edit the permissions click on the security group then click Advanced in the bottom right corner.

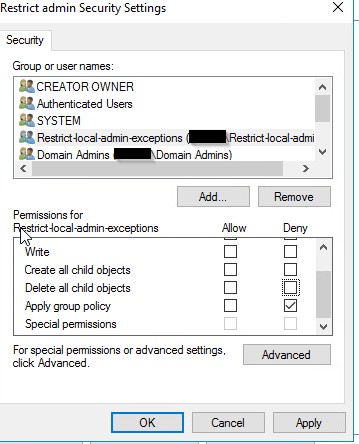
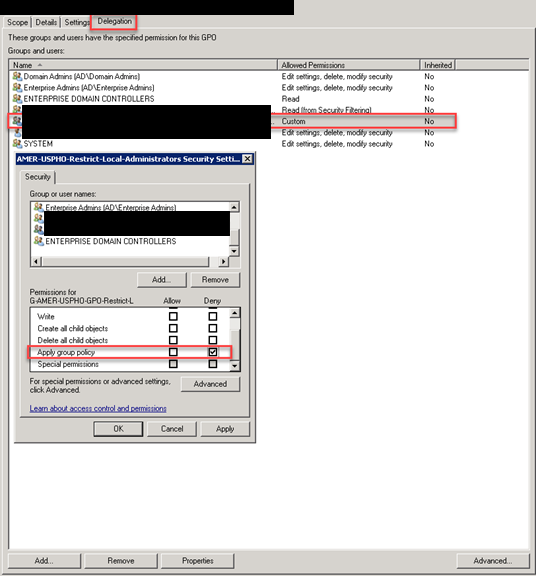
Now click on our security group we made, and click deny under Apply group policy. This is the only thing you want to Deny. Click OK. You are now done creating the GPO.

Once the GPO is linked, all users (and potentially all groups) not specified in the policy will be removed from the “Administrators (built-in)” group on any computer to which the policy is applied.

Exceptions to the policy can be made, such as allowing an AD account to remain in the “Administrators (built-in)” group or creating an account local to that computer. To do this, prevent the application of the Group Policy to that computer by placing the computer object into a security group for such exceptions. This will deny the ability to apply the settings contained in the Group Policy to that computer.

Managing exceptions then becomes an exercise in simply adding or removing computers from the security group set up to hold the machines where an exception is desired and then using GPUPDATE or allowing the GPOs to refresh.

Create a security group for exceptions. Open Server Manager and click Tools > Active Directory Users and Computers.

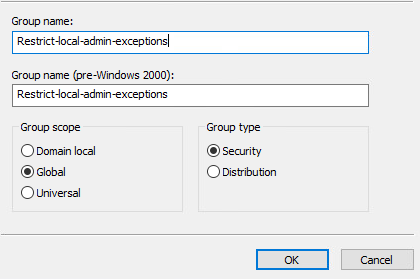
In the navigation pane select the contain in which you want to store the group. For the name of the group you should refer to this as the Admin Exceptions. For the description, Computers in this group will not receive the GPO that removes admin accounts. In the Group scope the selection depends on your Active Directory forest structure. If all of the members are from the same domain, then use Global. In the group type section, click security, then click OK.

It’s important to note that exceptions are applied upon the computer object, not on the user object for the user being granted an exception.

The net effect is that this becomes, in essence, a “Deny All” type approach. Member AD and local accounts not listed in the policy will be stripped from the group each time the policy is applied, unless the computer is a member of the “exceptions” security group. This allows for a standardized and somewhat “set and forget” model for enforcement on computers where no exception is required.

Enforcement Strategy/Plan

While the initial setup of the Group Policy objects and “exceptions” security group might take some effort, once configured it will require little in the way of maintenance.

Auditing and Monitoring

While the Group Policy method of restricting membership in the local “Administrators (built-in)” group offers no immediate auditing or monitoring abilities, there are ways to create those mechanisms via native tools such as PowerShell or potentially use tools such as Alert Logic to provide those capabilities.

For example, since exceptions are granted based upon membership in a security group, it would be possible to dump a list of the members of these groups and compare them against a list of machines where an exception has been granted. Similarly, reports can be run against machines where exceptions have been permitted to ensure that only the authorized accounts have been added to the “Administrators (built-in)” group.

Thank you for reading and if you have any questions please comment below.

PoshPatch

I’m excited to share with you about the application I created in PowerShell called PoshPatch. As system administrator, I found myself constantly managing and administering Windows computers. I knew there had to be a more efficient and user-friendly way to handle patch management, so I decided to create my own tool.

The first step in creating PoshPatch was deciding what features I needed. I wanted a tool that would allow me to easily perform actions on multiple machines, such as installing updates and executing scripts. I also wanted to be able to export the gathered data and run PowerShell commands on multiple machines simultaneously.

Once I had a clear idea of what I wanted, I began working on the application itself. I decided to use PowerShell with a graphical user interface (GUI) to make it as user-friendly as possible. The result was a lightweight PS1 file that could be launched without any installation process.

To make the tool as efficient as possible, I included a menu with Get and Run options, so I could easily execute patch-related tasks. I also made it possible to load a list of computer names or IP addresses and easily select one or multiple hosts from the grid to perform actions on.

As I was working on the application, I ran into some challenges. One of the biggest challenges was figuring out how to make it as versatile as possible without making it too complicated to use. I spent a lot of time fine-tuning the user interface and ensuring that the application was intuitive and user-friendly.

Despite the challenges, I’m proud of what I was able to accomplish with PoshPatch. The application is not only powerful and versatile, but it’s also completely free to use. Anyone can download it and start using it to streamline their patch management workflow.

Overall, I’m excited to share PoshPatch with other IT professionals and system administrators. I believe it’s a must-have tool for anyone who needs to manage a large number of Windows machines. It’s the perfect tool for simplifying patch management and making it easier to stay informed about your system’s status.

Log4jSherlock

Hello everyone! I want to share with you about my weekend project called Log4Sherlock. I wrote this application to detect CVEs in Log4j scanner, a tool that scans for JAR, WAR, EAR, JPI, HPI that contain the affected JndiLookup.class even in nested files. Log4Sherlock works by scanning all local drives on a system it is run on and grabs pom.properties inside one of the above file types, even in nested files (to obtain the version number). It then searches within the JAR file for JndiLookup.class even in nested files. Files containing JndiLookup.class with vulnerable versions are marked with appropriate CVE and the logs are saved in CSV, JSON, and txt log.

Log4Sherlock was developed to scan for the following CVEs: CVE-2021-44228 Apache Log4j2 2.0-beta9 through 2.12.1 and 2.13.0 through 2.15.0 JNDI, CVE-2021-45046 Apache Log4j 2.15.0, and CVE-2021-45105 Apache Log4j2 versions 2.0-alpha1 through 2.16.0.

One of the reasons why I decided to write this tool was because I noticed that some other scanners did not consider some important points that would let some of these vulnerable files through the cracks. For example, some scanners only scan for JAR files or scan for hashed jar files which doesn’t account for nested files. However, Log4Sherlock scans JAR, WAR, EAR, JPI, HPI, checks nested files, and does not unzip files, just loads them into memory and checks them, making the scanner fast and accurate.

The core value of Log4Sherlock is that it scans multiple computers remotely and uses remote systems resources to make scanning fast. It also does not hash the JAR as it could be nested or edited. Log4Sherlock identifies the following vulnerabilities CVE-2021-44228, CVE-2021-45046, CVE-2021-45105, and searches all drives on the system, excluding mapped drives. It creates a CSV list of affected files and locations and a JSON file with all information including errors like access issues to folders (so you know spots that might have been missed).

To use Log4Sherlock, download the ps1 file from log4jSherlock.ps1 and create the file computers.txt. Fill computers.txt with hostnames and run ps1. You can visit https://github.com/Maelstromage/Log4jSherlock for the complete repository.

Overall, Log4Sherlock is a fast and accurate scanner that can help you detect CVEs in Log4j scanner. I hope this tool can be useful to you and thank you for taking the time to read about it.

A monitoring tool: Fun with Powershell, SQL and Graphana

I set up a custom monitoring solution for my network devices using Grafana and a PowerShell script that inserts ping test results into a MariaDB database. I was using PowerShell soley by itself with a console output to monitor my switches. I wanted a better way to monitor my network devices that was more visual, and this setup seems like it could be just what I need.

The first step in setting up the solution was creating a MariaDB database to store the ping test results. I was not very familiar with databases, but a previous project got me excited about SQL so it took a bit of time, but I got it set up. Now I am able to set up efficient database according to best practices. Once I had the database created, I modified my original script. I modified it to insert the ping test results into a table called “ping_log”. The script runs continuously, inserting ping test results into the database every 5 seconds.

With the ping test results stored in the database, I set up Grafana to create custom dashboards that display real-time or historical ping results for the devices that are being monitored. By connecting Grafana to the same MariaDB database that the PowerShell script is writing to, I was able to create SQL queries that retrieve data from the “ping_log” table and display it in a variety of visualizations, such as line charts or bar graphs.

I’m excited about the potential of this setup. I like how customizable it is, and I can adjust the frequency of the ping tests by changing the timedelay parameter in the PowerShell script. Plus, I can create custom SQL queries in Grafana to retrieve specific data from the “ping_log” table, which will be really helpful when I need to troubleshoot issues with my network devices.

Overall, I feel like I’ve made some good progress. This setup looks great and it is very exciting to see this running along side Prometheus.

Graphana & Prometheus

I’m excited to share with you my experience with using Graphana and Prometheus together. As a systems administrator, I’ve found this combination to be incredibly powerful for monitoring and visualizing metrics in real-time.

First off, let’s talk about what these two tools are. Prometheus is a monitoring and alerting toolkit that collects metrics from different sources and stores them in a time-series database. Grafana is a data visualization tool that allows you to create customizable dashboards and graphs from the data stored in Prometheus.

What is really great is the ability to create real-time dashboards that update automatically as new data comes in. This can be incredibly useful for monitoring the health of your applications or infrastructure and responding quickly to any issues that arise.

I have this running on a large monitor and it cycles through all the servers. I have already caught a few cpu and hard drive issues. I can also see if something goes down. This is great to stay ahead of any outages before they cause too many issues with production.

It is the flexibility of Grafana’s visualization options that makes it shine. You can create a wide range of visualizations, including graphs, tables, and even maps. This makes it easy to create custom dashboards that are tailored to your specific needs.

From a technical perspective, Prometheus uses a pull-based model to collect metrics, which means that it periodically scrapes targets for data. This is different from some other monitoring tools that use a push-based model, where the targets send data to the monitoring tool. The advantage of the pull-based model is that it’s more flexible and allows you to collect metrics from a wider range of sources, and who really wants to have another agent in your environment.

This one of my favorite things I have set up. I would highly recommend this free solution to all of my fellow system administrators out there.

© 2024 Harley Schaeffer

Theme by Anders NorenUp ↑