I set up a custom monitoring solution for my network devices using Grafana and a PowerShell script that inserts ping test results into a MariaDB database. I was using PowerShell soley by itself with a console output to monitor my switches. I wanted a better way to monitor my network devices that was more visual, and this setup seems like it could be just what I need.
The first step in setting up the solution was creating a MariaDB database to store the ping test results. I was not very familiar with databases, but a previous project got me excited about SQL so it took a bit of time, but I got it set up. Now I am able to set up efficient database according to best practices. Once I had the database created, I modified my original script. I modified it to insert the ping test results into a table called “ping_log”. The script runs continuously, inserting ping test results into the database every 5 seconds.
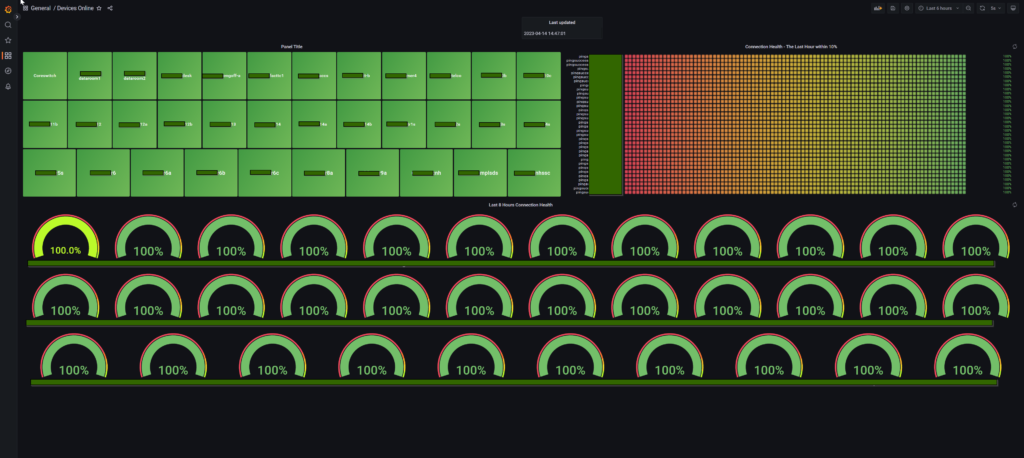
With the ping test results stored in the database, I set up Grafana to create custom dashboards that display real-time or historical ping results for the devices that are being monitored. By connecting Grafana to the same MariaDB database that the PowerShell script is writing to, I was able to create SQL queries that retrieve data from the “ping_log” table and display it in a variety of visualizations, such as line charts or bar graphs.
I’m excited about the potential of this setup. I like how customizable it is, and I can adjust the frequency of the ping tests by changing the timedelay parameter in the PowerShell script. Plus, I can create custom SQL queries in Grafana to retrieve specific data from the “ping_log” table, which will be really helpful when I need to troubleshoot issues with my network devices.
Overall, I feel like I’ve made some good progress. This setup looks great and it is very exciting to see this running along side Prometheus.