I’m excited to share with you my experience with using Grafana and Prometheus together. As a systems administrator, I’ve found this combination to be incredibly powerful for monitoring and visualizing metrics in real-time.
First off, let’s talk about what these two tools are. Prometheus is a monitoring and alerting toolkit that collects metrics from different sources and stores them in a time-series database. Grafana is a data visualization tool that allows you to create customizable dashboards and graphs from the data stored in Prometheus.
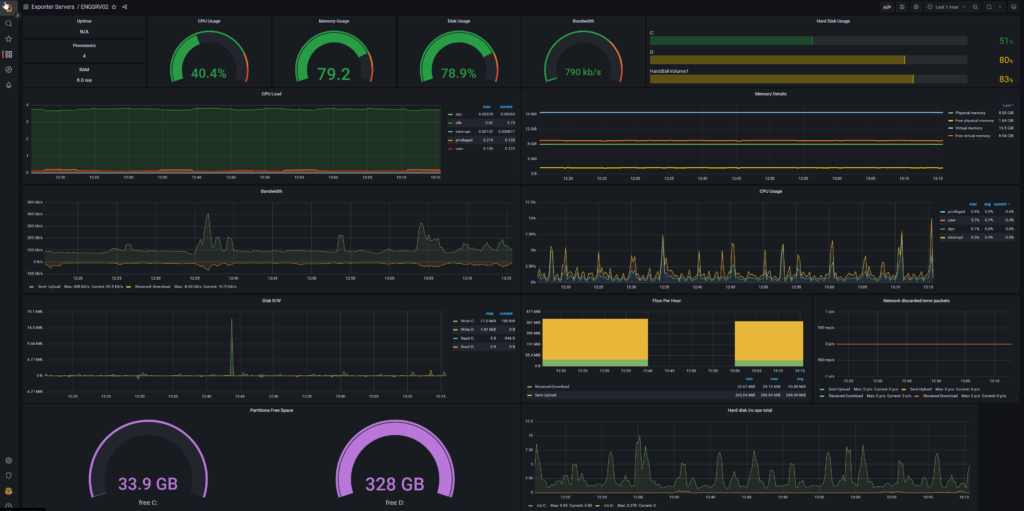
What is really great is the ability to create real-time dashboards that update automatically as new data comes in. This can be incredibly useful for monitoring the health of your applications or infrastructure and responding quickly to any issues that arise.
I have this running on a large monitor and it cycles through all the servers. I have already caught a few cpu and hard drive issues. I can also see if something goes down. This is great to stay ahead of any outages before they cause too many issues with production.
It is the flexibility of Grafana’s visualization options that makes it shine. You can create a wide range of visualizations, including graphs, tables, and even maps. This makes it easy to create custom dashboards that are tailored to your specific needs.
From a technical perspective, Prometheus uses a pull-based model to collect metrics, which means that it periodically scrapes targets for data. This is different from some other monitoring tools that use a push-based model, where the targets send data to the monitoring tool. The advantage of the pull-based model is that it’s more flexible and allows you to collect metrics from a wider range of sources, and who really wants to have another agent in your environment.
This one of my favorite things I have set up. I would highly recommend this free solution to all of my fellow system administrators out there.